MZ-Systems GmbH


Power and heart rate

Pro Power

Power-HR
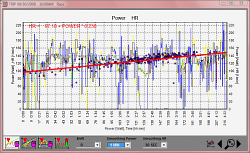
Analysing the Relationship of Power and Heart Rate.
Yellow: Power
Blue: average of the power
Red-Green graph: heart rate (hr)
Red: increasing hr
Green: decreasing hr
Points: relation between average of the power and the increasing heart rate
The scale for the power value of the points is the x-axis
Red line: linear regression of the points

Pro Power

Power-HR
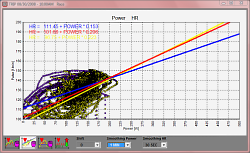
Analysing the Relationship of Power and Heart Rate.

Pro Power

Power-HR
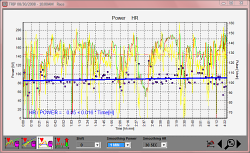
Analysing the Relationship of Power and Heart Rate.
Red-Green graph: heart rate (hr)
Red: increasing hr
Green: decreasing hr
Points: relation between average of the power and the increasing heart rate by time
The blue graph is the linear rgeression of the points.
A rising tendency of the blue graph means a biological fatigue.

Pro Power

Power-HR
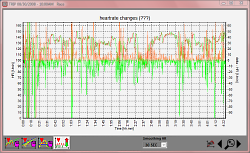
Analysing the Relationship of Power and Heart Rate.
It shows the reaction of the pulse.


Close


Kontakt per Mail   MZ-Systems Micro-Computer-Entwicklung (Hard- und Software) GmbH    Fon: +49 (0) 6151 - 14 54 99