Analysing a trip |
|
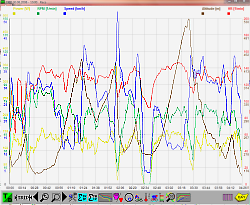
Description of one session
You see a graphical description of a session.
You can select the graphs individually.
Using the function buttons you can do
more data analysis:
|
|
Summary
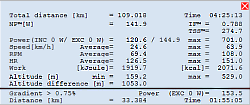
Analysing total trip.
Show an analysis of the complete trip in table form.
All values underneath the horizontal bar refer only to distance at an inclination
larger than the given value (e. g. in the example, it is more than 0,75 percent)
|
|
Analysing part of a session
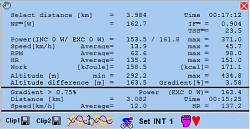
You get an analysis of a selected part of a session in a table form.
The analysis is the same as the one for the whole session. Furthermore you can see the average elevation between start
and finish easily above the horizontal bar.
You can save a part of a session in one trip. You can also save another part of a session in second clip, so that you can
compare both.
You can also add one ore more intervals and than you can jump from interval to interval. You see one interval in the window
and this interval you can anlyse separately.
|
|
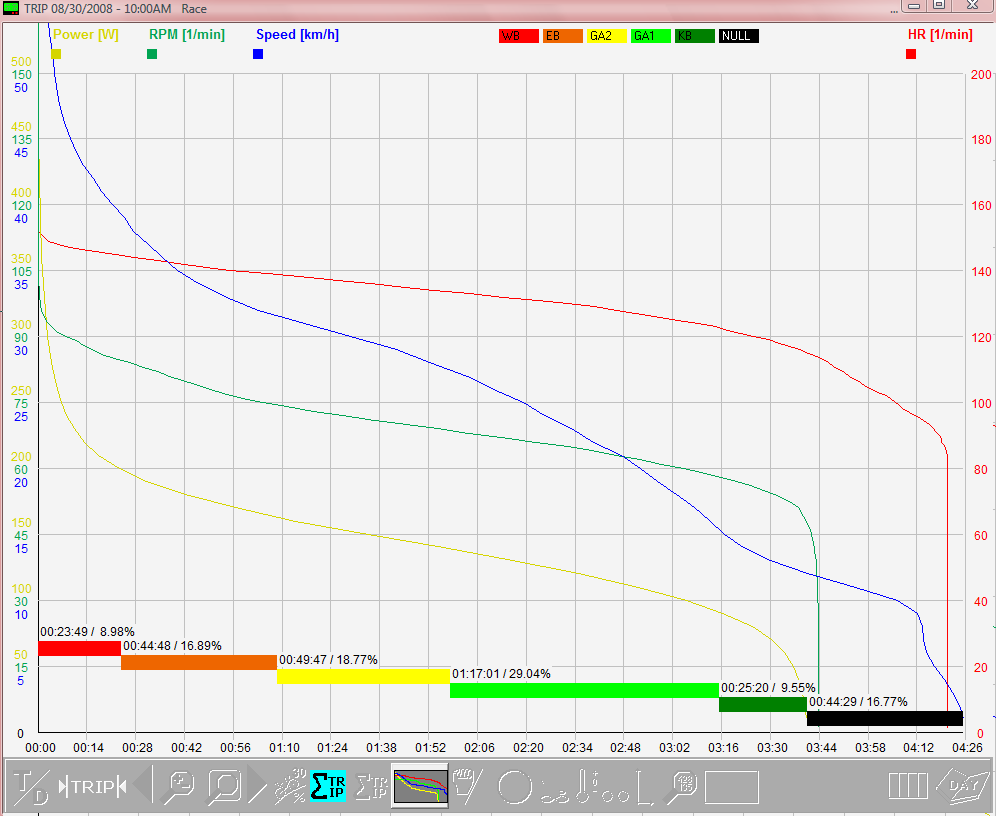
Training zones/Values sorted
The individual graphs are sorted: large values on the left, small values on the right.
The cumulative period (including breaks) in which you ride with a certain power is displayed
(e.g. during a trip you ride 3x for 5 minutes with at least 250 W power then the analysis
shows 15 minutes with power of 250 W or more).
|
|
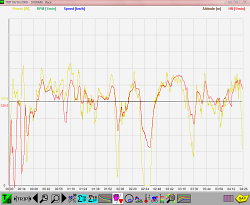
Power - heart rate
The power and heart rate courses are normalized to the average values.
Analyse and compare the development of power and heart rate.
|
|
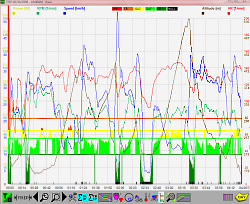
Threshold
Shows the threshold.
|
|
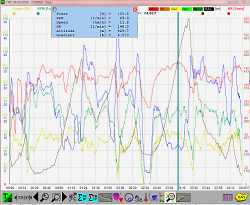
Data loupe
It shows the exact data.
|
|
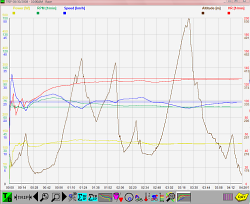
Characteristics of average
|
|
|
Close
|


