Analysis with the ergo
Racer® |
|
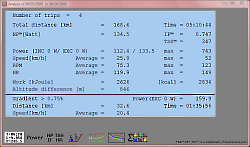
Statistic numerical
It shows a numerical summary of selected trips (min. 2).
Using the function buttons you can do more data analysis:
|
|
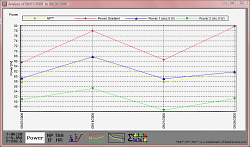
Statistic Power
Shows a graphical analysis of the selected trips with:
- NP™ (Normalized Power)
- POWER gradients
- Power EXC 0W (average power without zero values)
- Power INC 0W (average power including zero values)
Click on a graph shows a pie chart of the training zones.
|
|
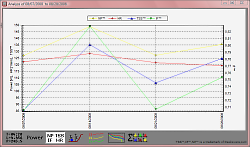
Statistic NP™, TSS™, IF™, HR
Shows a graphical analysis of the selected trips:
- NP™ (Normalized Power)
- AVERAGE HEART RATE
- TSSTM (Training Stress Score)
- IFTM (Intensity Factor)
Click on a graph shows a pie chart of the training zones.
|
|
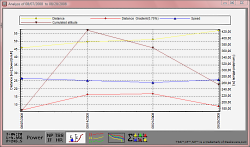
Graphic distance + accumulated height
Shows a graphical analysis of the selected trips:
- Distance (trip distance)
- Distance ST (distance at inclinations)
- Speed (average speed)
- Accumulated height
Click on a graph shows a pie chart of the training zones.
|
|
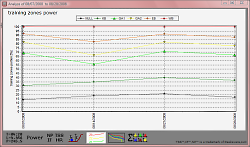
Statistic training zones
Show a graphical analysis of the selected trip with respect to different ranges of performance
as a percentage of the total period.
Click on a graph shows a pie chart of the training zones.
|
|
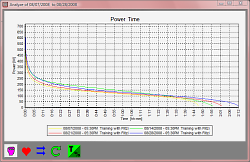
Values sorted
Shows a graphical analysis of the selected trips with respect to different parameters
(power, heart rate, speed and cadence) sorted by time or percentage. The cumulative period
(including breaks) in which you ride with a certain power is displayed (e.g. during a trip you
ride 3x for 5 minutes with at least 250 W power then the analysis shows 15 minutes with power of 250 W or more).
|
|
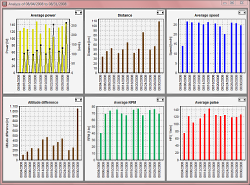
6er Chart
Show a graphical analysis of the maximum values of the selected trips.
The parameters that are shown can be defined in tools.
|
|
|
Close
|


